Tuesday, September 28, 2010

Tribe Starting Pitching Development: 2002-2004

Indians baseball of the late 1990's and early 2000's will long be remembered as one of the most exciting periods of baseball in the city of Cleveland.   Any fan can wax poetic for hours about any number of subjects about those teams, the incredible talent brought up througth the minor leagues, important veterans signed to add experience to the roster, free agent signings to bolster the team, or the  nearly 20 million fans attending games between 1995 and 2001 including 455 straight sellouts.  But ast the old saying goes, all good things must come to an end.  The Cleveland Indians finished 2001 with a record of 91-71 and were matched up against the Seattle Mariners who were coming off a record setting 111 win season.  The series would come down to a deciding fifth game and would see Jamie Moyer shut down the Indians offense and the Mariners walk away with a 3-1 victory.

For many of the Indian faithful, the period of baseball from 2000 to 2002 marks the shift from the penthouse to the outhouse and conincides with the purchase of the team by Larry Dolan from Dick Jacobs and the departure of John Hart marking the beginning of the Mark Shapior tenure as G.M.  Right in the middle of the transition from the penthouse to the outhouse, the organization felt it was time to move away from a manager that the fans of Cleveland could relate to in Charlie Manuel to a manager who never was endearing to the fanbase in Eric Wedge.  In the offseason following the loss to the Mariners, John Hart would resign as General Manger and be replaced by Mark Shapiro who would quickly dispatch Roberto Alomar off to the NY Mets.  As the year dragged on the team would continue their transition by dealing Bartolo Colon and Chuck Finley for prospects.  The Indian fans were either livid or apathetic after seeing Jim Thome leave via free agency in the offseason following the 2002 season (a discussion of who to blame is just as polarizing in 2010 as it was in 2002). 

The remnants of the 2001 season were not all negative as the Indians had developed a future ace in CC Sabathia. As a 21 year old Sabathia would go 17-5 in 2001 and be a beacon of hope for the fans.  Like the 1990-1993 teams, the Indians would begin to bring in ptichers from other organizations via trade or free agent signings and bring young arms up from the minor leagues in an attempt to build the foundation of another club that could return to the playoffs.  The starting pitchers used by the Tribe, including the number of starts by each player, are included in the table below.


Several of these pitchers were called up from the Tribes minor league system.  These pitchers were the group  that the Tribe had hoped would take spots in the rotation and lay the foundation of the pitching staff, which along with CC Sabathia would be able to return the Tribe to the postseason.  The table below shows the Tribe's young arms and how they fared in their first 10 major league starts. 


Out of this group the Tribe found a future Cy Young Award winner in Cliff Lee and a solid complement to Sabathia and Lee in Jake Westbrook.  The 2005 season would see the Cleveland Indians eliminated on the final day of the season despite winning 93 games.  The Indians would only use 6 starting pitchers during the 2005 season.  Cliff Lee would win 18 games for the Tribe, CC Sabathia and Jake Westbrook would each win 15 games,  and vetran reclamation projects Kevin Millwood would win the AL ERA Title.  CC Sabathia, Jake Westbrook, and Cliff Lee would lead the Tribe to the AL Championship Series in 2007.


Saturday, September 25, 2010

Tribe Starting Pitching Development:1990-1993

As the Indians continue through the dreaded rebuild cycle, the team will inevitably give an opportunity to some of their young arms, acquire arms from other organizations, and bring in a host of experienced guys. Some will be longer in the tooth than others, some more toolsy, and some with what pitching coaches would phrase as good "stuff".

This same process has been repeated from around 1990-1993, 2002-2004, and 2006-2010.  The data provided here looks at the starting pitchers and the first 10 starts for the younger group of Tribe pitchers during the year 1990-1993. 

1990-1993
The Tribe would compile a record of 286-362 during the years of 1990-1993, including a dismal 105 loss season in 1991.  They would use 13 different starters would be utilized in 1990, 14 in 1991, 13 in 1991, and 18 in 1993.  The 18 starters used by the Tribe in 1993 is the 4th most starters used in baseball history.  The starting pitchers used by the Tribe, including the number of starts by each player are included in the tables below.


Several of these pitchers were called up from the Tribes minor league system.  These pitchers were the group  that the Tribe had hoped would take spots in the rotation and lay the foundation of the pitching staff, which along with the offensive machine the Tribe was building would be able to compete into the late 90's.  The table below shows the Tribe's young arms and how they fared in their first 10 major league starts.  Of course, only Charles Nagy filled the potential that the Tribe had hoped for.


The Tribe would turn to Jack Morris and Dennis Martinez to help fill the rotation in 1994 and would add Orel Hersheiser in 1995.  The 1995 squad would go to the World Series with a rotation of Dennis Martinez, Orel Hersheier, Charles Nagy, Chad Ogea, Mark Clark, and Ken Hill.  In two short years after using a staggerring 18 strarting pitchers to get through the season, the Tribe was able to make it the World Series. 

Wednesday, September 22, 2010

Carrasco Makes His Final Star of 2010: Tribe Falls 5-1 vs Twins

Carlos Carrasco made his 10th career start today (September 22, 2010) against a Minnesota Twins lineup featuring what could be defined as their B-lineup which had a total combined WAR of  7.5.  Carrasco pitched effectively going 6 innings and surrendering 3 earned runs while striking out 4 and walking 3.  The Tribe offense was unable to muster up the run support to back Carrasco's effort against Twins starter Nick Blackburn as the Twins went on to win 5-1.  The Tribe offensive woes on the day may be explained by their lineup combined WAR of 5.9!

Carrasco pitched effectively during his five 2010 starts (1-1, 3.03 ERA, WHiP of 1.286), which is in start contrast to his 2009 performance (0-4, 8.87 ERA, WHiP of 1.612).  Carrasco becomes the fourth Tribe starter in 2010 to appear in their 10th Major League start.  He joins Mitch Talbot, Jeanmar Gomez, and Josh Tomlin.  The table below details the most recent starting pitchers to complete the majority of their first 10 starts with the Tribe (for comparison I've included Justin Masterson's first 10 starts with Boston).

Friday, September 17, 2010

Quick Hit: Tribe's 20/20 Club: UPDATE

Thanks to a monster 4-game series in Kansas City and a scoring change from a fielders indifference to stolen base, Shin-Soo Choo has completed a 20 HR/20SB season for the 15th time in Cleveland Indian history.  Choo's monster series in KC is another example of why WE watch the games:

Rk Player 5 HR SB Year Age
1 Albert Belle 38 23 1993 26
2 Bobby Bonds 25 34 1979 33
3 Grady Sizemore 33 38 2008 25
4 Grady Sizemore 28 22 2006 23
5 Grady Sizemore 24 33 2007 24
6 Grady Sizemore 22 22 2005 22
7 Joe Carter 32 31 1987 27
8 Joe Carter 29 29 1986 26
9 Joe Carter 27 27 1988 28
10 Matt Lawton 20 23 2004 32
11 Roberto Alomar 24 37 1999 31
12 Roberto Alomar 20 30 2001 33
13 Shin-Soo Choo 20 20 2010 27
14 Shin-Soo Choo 20 21 2009 26
15 Toby Harrah 20 20 1979 30
Provided by Baseball-Reference.com: View Play Index Tool Used
Generated 9/20/2010.


The Cleveland Indians have  had had 7 players hit 20 home runs and 20 doubles in a season.  The 1979 season saw Bobby Bonds and Toby Harrah become the first Cleveland Indians to complete the task.  They would be follwed by Joe Carter (3x), Albert Belle, Roberto Alomar (2x), Matt Lawton, Grady Sizemore (4x), and Shin-Soo Choo.  It appears that the 2010 season will come to an end with Shin-Soo Choo falling short of getting to 20/20 for a second time.   A healthy Grady Sizemore in 2011 along with Shin-Soo Choo may see the Tribe with a chance to have two players with 20/20 for only the second time in club history. 

PlayerHRSBYear Age
Bobby Bonds2534197933
Toby Harrah2020197930
Joe Carter2929198626
Joe Carter3231198727
Joe Carter2727198828
Albert Belle3823199326
Roberto Alomar2437199931
Roberto Alomar2030200133
Matt Lawton2023200432
Grady Sizemore2222200522
Grady Sizemore2822200623
Grady Sizemore2433200724
Grady Sizemore3338200825
Shin-Soo Choo2021200926
Provided by Baseball-Reference.com: View Play Index Tool Used
Generated 9/17/2010.

Thursday, September 16, 2010

Quick Hit: Offense is Offensive

In case you haven't noticed, and judging by the attendance you haven't, the Indians have managed to get shut-out a few times here and there.  The Tribe has been shut out 15 times this year, which is second in the Majors (LA Dodgers lead with 16) and first in the American League.  How does being shut out 15 times in a year rank in Tribe history?


The Tribe's record for being shutout in a season is 20 times and that occurred in 1968, a year in which the Tribe finished third in the AL East with a 86-75 record.  The Tribe's shutout total did not lead the majors in 1968, they finished 6th.  The LA Dodgers led the league by being shut out 23 times and their were a total of 326 shutouts in the majors that year. The 1968 season was known as the year of the pitcher and to remedy the dominance of pitching the mound was lowered the following year.   Other years of offensive futility weren't masked by winning.  The following table details the seasons where the Tribe was shut out 15 or more times, the corresponding team win loss, the amount of shutouts thrown in the majors that year, and the % of the shutouts belonging to the Tribe.


As fans we probably all have a little John McKay in us.  After another Buccaneer loss he was asked how he felt about his offensive execution and his response was that he was all for it.

I have provided the following link to allow anyone to access the data used to create the Table at https://spreadsheets.google.com/ccc?key=0Avro9wJRzEASdF9fVFFrUURXT2hzTUY2UV8xcTRDZGc&hl=en&authkey=CJrwjNAF

Wednesday, September 15, 2010

Chris Perez & Closers

Chris Perez future closer or a set-up man on a hot streak?  Can Cleveland Indian fans feel confident that Chris Perez is their closer in 2011? 

No matter how we as fans try to determine the effectiveness and/or value of a closer, someone will always finding the exception(s) to the rule.   One instance of this is the fact that regardless of a teams overall win-loss record, approximately 90% of the time that a team is leading after 8 innings that team goes on to win the game.  For example, the 2010 Washington Nationals have an overall record of 61-84 but have a record of 54-1 when leading after 8 innings.  We could look at ERA and say that is a good barometer of a closer, but we can point to Joe Borowski who lead the American League in saves in 2007 with an ERA of 5.07.  We could also temper a bad ERA by suggesting that the reliever got hit hard in one or two appearances.  I've even had an individual suggest that the body of work means very little until that closer is closing games that are "important".  What an important game is could lead to another round of arguments and exceptions.

So, is Chris Perez an effective closer?  Is it fair to have optimism toward 2011 or is the fact that he isn't pitching in "important games" working against him?  I've compiled statistics for 14 American League relievers who met the following criteria: 90% of appearances are in relief, a minimum number of 25 innings pitched, and a minimum of 15 saves credited.   Chris Perez rankings out of the 14 relievers and the standard stats are presented in the tables below.  It should be noted that Perez did compile some of his statistics in the set-up role.

 Using the traditional statistics presented in Table 1, it would seem as if Chris Perez is a below average closer.  He ranks 9th or lower in Wins, Saves, K/9, WHiP, and K/BB.  He fares slightly better ranking 4th in BB/9 and ERA and ranks 5th in IP.   Table 3 will include some of the less traditional statistics, such as inherited runners (IR), inerited runners scored (IS), inherited runners scored percent (IS%), #R is the number of apperances the pitcher gave up at least one run and #ER is the number of appearances the pitcher gave up at least one earned run.  From the #R and #ER data I compiled a list of the percetage of appearances where the pitcher gave up an earned run and the percentage of scoreless appearances.

Table 1: Chris Perez Rankings


Table 2: 2010 AL Statistics through September 14, 2010


Table 3: AL Statistics through September 14, 2010

From examining Table 3, we can see that Perez has the most inherited runners with 30, which is due to the fact that he spent time in the set-up role for part of 2010.  Perez only allowed 7 of the 30 inherited runners to score (23%) which may be a sign that he is able to pitch effectively in high leverage situations.  Out of Chris Perez' 59 appearances, he only allowed an earned run in 6 of those appearances (~10%) which is good for second on the list.  Chris Perez has held the opposition scoreless 88% of his 59 appearances which puts him 2nd on the list. 

One may reach the conclusion that based on the fact that Perez has been effective when entering games with men on base (23% IR) and the amount of scoreless appearances by Chris Perez (88% [52 out of 59 appearances]) that Perez is ready to pitch in "important" games but to be considered a dominant closer as soon as the Indians middle relief begins to get the ball to him to shut the door.

You'll notices the last column on Table 3 showing a thread of numbers 4,4,3,3,2,... this represents the number of earned runs given up >1 run. 

Although this data is presented highlighting Chris Perez, I have provided the following link to allow anyone to manipulate the data.  https://spreadsheets.google.com/ccc?key=t8RIwMpV2WPB2-mwZe82a1Q&authkey=CKqDoZwG&hl=en#gid=0

Enjoy,

Tuesday, September 14, 2010

Josh Tomlin vs Los Angeles Angels (September 8th and 14th, 2010)

On September 8, 2010, Josh Tomlin and the Cleveland Indians took on the Los Angeles Angels of Anaheim in a 7:00 EST start.  If you are like me, a baseball junkie, you were happy to have an early evening to conclude the West Coast Trip. after several late nights  Of course, the game ended up going 16 innings and ending with a Tribe loss 4-3 on a sac fly after the calender had flipped to September 9, 2010 on the East Coast.  Tomlin would have an opportunity to face the Angels again last evening (September 14, 2010) in Cleveland.


The lineups were essentially the same for both Tomlin starts, with the only difference being Howie Kendrick and Hideki Matsui  rather than Kevin Frandsen and Reggie Willits.  Let's take a look at how Tomlin approached each starts.


Tomlins final line on September 8, 2010 was 6 IP, 3 ER, 3 H, 2 BB, 4 K, and he allowed 2 HR. Tomlins final line on September 14, 2010 was 6.2 IP, 3 ER, 7H, 1 BB, 4 K, and he allowed 0 HR.


On September 8, 2010, Tomlin would work 6 innings and throw 88 pitches.   He would throw 63% (56 pitches) for strikes.  The pitching breakdown was as follows: fastball 50%, the sinker 11.3%, the changeup, the changeup 6.8%, the curveball 9.1%, and the cutter 22.7%.  Tomlin would have a swing and a miss of 7.9% and he would get the majority of the swing and misses on his cutter.


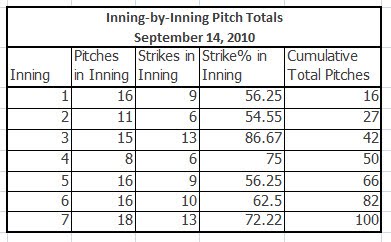
On September 14, 2010, Tomlin would work 6.2 innings and throw 100 pitches.  He would throw 66% (66 pitches) for strikes.   The pitching breakdown was as follows: fastball 38%, the sinker 22%, , the changeup 9%, the curveball 12%, and the cutter 19%.  Tomlin would have a swing and a miss of 7% and like his last start versus the Angels,  hewould get the majority of the swing and misses on his cutter.


As evident by the similar swing and miss percentage, Tomlin wasn't any more crafty on the September 14th start compared to the September 8th start.   It appears as if the biggest change between the first start and the second start was in the amount of fastballs thrown,  Tomlin was able to keep the Angel hitters (and arguably a better lineup) off balance by  attacking the same lineup with a different arsenal.   Tomlin was rewarded with a victory when his bullpen was able to keep the lead and the Indians won 4-3.