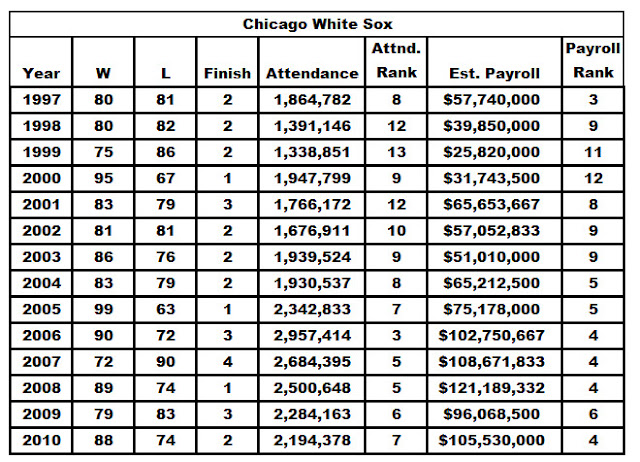
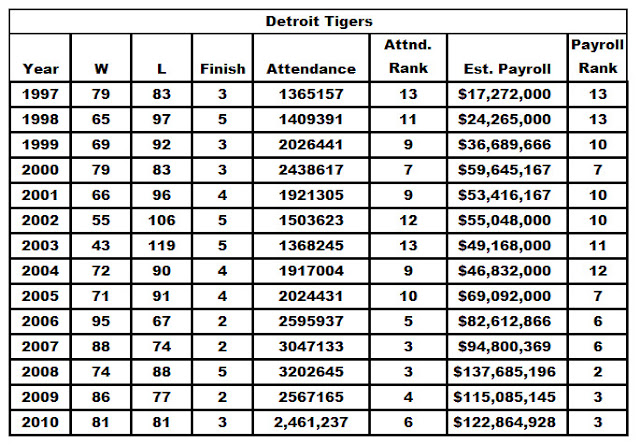
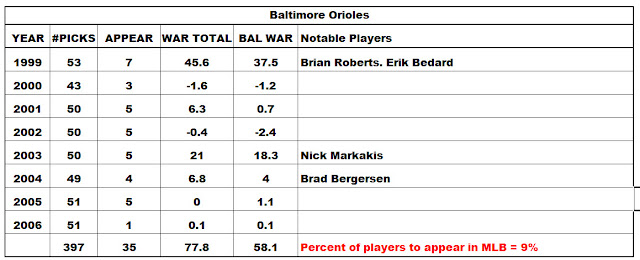
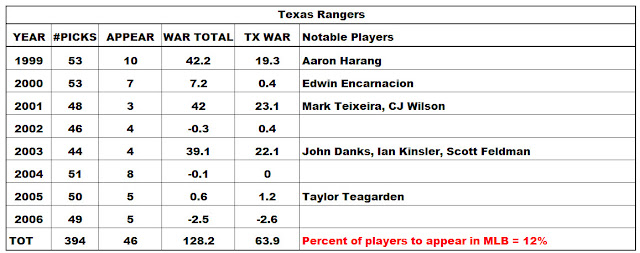
Every major league baseball organization has a different roadmap to success, but drafting and developing young talent is important. The question I initially had was how well do teams draft and how does good drafting affect performance on the field. If a team doesn't draft well, is it reasonable to assume ownership has to support a higher payroll to achieve success? For each Amercian League team, I've included a brief look at the performance from 1997 through 2010, a recap of the 1999-2006 draft results with associated Wins Above Replacement (WAR). Additionally, since a teams drafting record isn't the number one deciding factor for organizational performance (latin america/asian signings, trades, etc), I've included attendance and payroll data for each team as well as W-L record.
I wanted to examine each teams drafts over a select period of time. The Point in Time Analysis method always leads to questions as to how the period of time was determined. Was the period of time cherry picked to fit some preconcieved notion, was it arbitrary, or was there some reasoning behind it? I chose to look at the 1999 to 2006 draft results for the Amercian League as I felt that players drafted in that 8 year period have had ample opportunity to develop and make their mark in the major leagues.
The next hurdle I had to overcome was to find a way to judge a drafts success or failure. It can not be looked at by the number of players to make it to the majors, since that percentage is betwen 8 and 13 percent for all teams and making it to the major leagues is no guarantee that the player made a significant impact. Additionally, I wanted to look at how well a team targeted talent, this would include players taken that were unable to be signed. Like a salesman that has to dollarize a product to the customer, I was looking for a way to dollarize the strength or weakness of a MLB draft. To do this, I chose the statistic for Wins-Above-Replacement (WAR). The WAR statistic, like Point in Time Analysis can lead to many differring opinions on its utility. In this case, the statistic is used as a way to capture a number that may help dollarize the draft results. As mentioned earlier, I wanted to be able to look at the overall talent recognized by the organizations draft team as well as how the players fared in that drafting teams uniform; therfore, the WAR is broken down into Total WAR and Team WAR.
AL DRAFT RECAP 1999-2006

TAMPA BAY RAYS
BALTIMORE ORIOLES
TORONTO BLUE JAYS

LOS ANGELES ANGELS

TEXAS RANGERS

SEATTLE MARINERS


The percentage appearing for the Royals looks off -- I get 39/408 = 9.6%.
ReplyDeleteThanks Saucer, Edit has been made.
ReplyDelete